What Your Power Meter Can't See
Dave · June 26, 2026
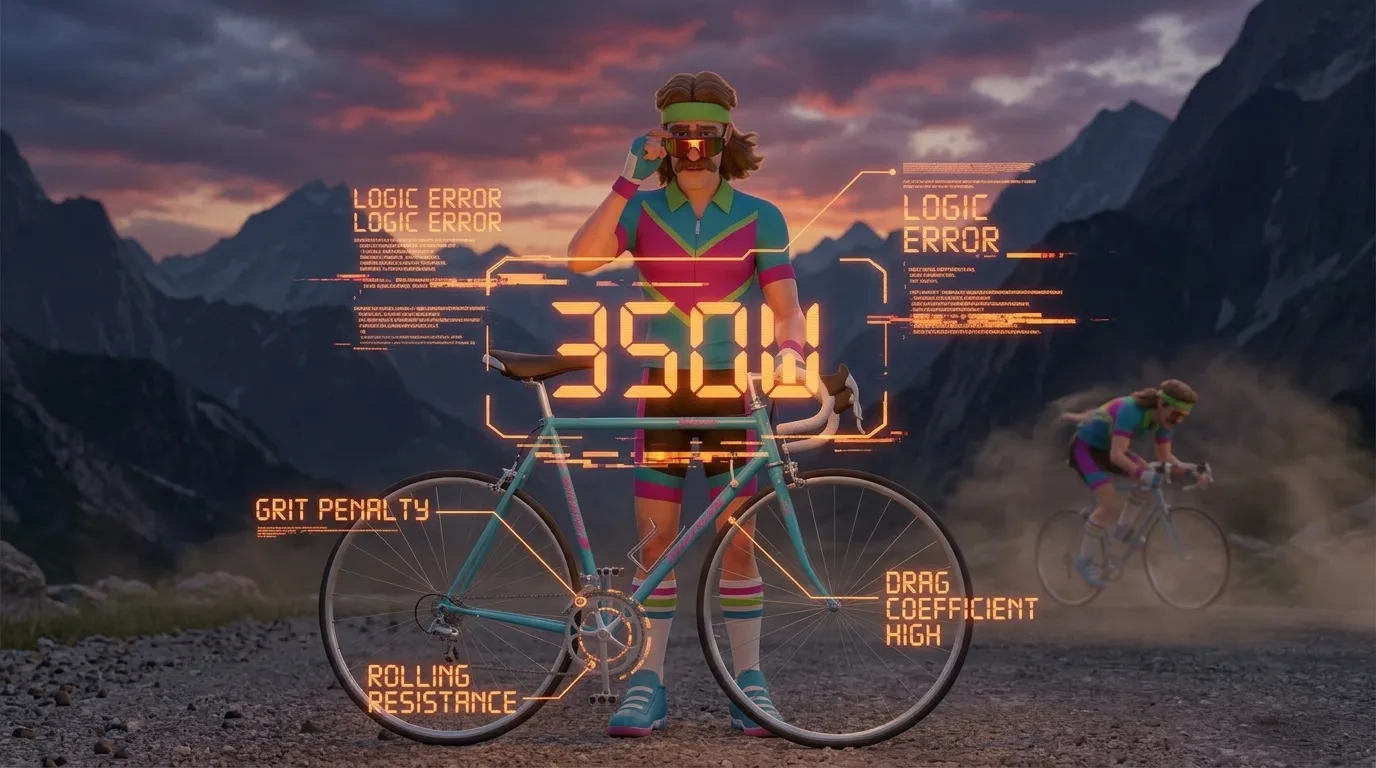
Your power meter is telling you the truth. It’s just not telling you the whole truth. A 250-watt effort on a flat road after a good night’s sleep, with a tailwind, fresh legs, and your head in the game is a completely different animal from 250 watts on the third day of a stage race, grinding into a headwind up a false flat, running on gas station coffee and spite. Same number. Completely different story. This is the thing most riders miss when they stare at their data: the number is just the start. What cycling data am I missing? Usually, it’s everything around the number.
Wind Is Doing More Work Than You Think
Let’s start with the invisible hand on your back — or in your face. Wind can swing your effective power output by 50 watts or more. You can be pushing 280 watts into a headwind and riding slower than someone putting out 230 with a tailwind. Your power meter doesn’t care. It just logs the effort and moves on. I filmed an episode of Pedal to the Medal on the California coast once. We had to reshoot the whole segment because I looked like I was suffering through a mountain stage. It was a 2% descent. Pure headwind. Context cycling performance starts with the air you’re riding through.
If you’re not tracking wind speed and direction alongside your power data, you’re reading half a sentence and calling it a novel.
The Terrain Underneath You Tells a Different Story
A 200-watt average on a rolling course is nothing like 200 watts on a dead flat road. On rolling terrain, your power is spiking on the climbs and recovering on the descents. Your heart rate lags. Your muscles are getting micro-recoveries even as your average looks moderate. On flat road, 200 watts is relentless. No spikes. No relief. The demand on your system is fundamentally different even though the number looks the same.
This is why normalized power exists — it’s trying to account for variability. But even NP doesn’t capture everything. It doesn’t know if those climbs were technical switchbacks demanding constant attention, or smooth grades where you could just sit and push. Terrain shapes effort in ways no single metric catches cleanly.
Fatigue Lives Below the Surface
Here’s a question worth asking when your numbers look off: why is my power lower than usual? The first thing people check is sleep, and yes, that matters. But fatigue is deeper than one bad night. Cumulative training load, life stress, travel, illness, nutrition — all of it piles up and shows up in your legs before it shows up anywhere else.
I’ve seen riders log their worst power outputs in the week that turned out to be their best fitness block. They were just cooked. The adaptation was happening, the power wasn’t there yet, and the data looked like regression. If they’d chased the number that week, they’d have buried themselves. Instead they backed off, absorbed the load, and came back swinging. Fatigue without context looks like failure. With context, it’s often just timing.
Pacing Strategy Changes What the Numbers Mean
Here’s one that trips up a lot of data-driven riders. You can game your average power upward by going out hard and hanging on. You can also ride a perfectly controlled effort that feels easier and produces a better performance. Same average power at the end. Very different execution. Very different physiological cost.
If you’re doing a 40-minute climb and you smash the first ten minutes at threshold because you felt good, your average might look fine. But you’ve already burned something you can’t get back, and the last twenty minutes will be a negotiation with your own legs. Pacing context is everything for understanding what a ride’s power data actually represents. Was it controlled? Blown up? Negative split? The shape of the effort matters as much as the size.
Your Physiology Isn’t Fixed
This one took me a long time to fully appreciate. Your FTP is not a ceiling. It’s a current estimate, and it moves around more than people expect. Heat acclimatization, altitude, illness recovery, menstrual cycle phase, hydration status — all of these shift your physiological capacity on any given day. A rider who’s been training at altitude for three weeks will have a different power ceiling at sea level than one who’s been at home. A rider doing a key effort in 35-degree heat is operating in a fundamentally different physiological environment than the same rider in cool conditions.
The number on your head unit is your output in that specific body, on that specific day, in those specific conditions. It’s not a verdict on your fitness. It’s a snapshot with context baked in whether you asked for it or not.
What’s Happening in Your Head Shows Up in Your Watts
This is the one nobody wants to talk about because it feels soft. It isn’t. Mental state is a performance variable. Motivation, perceived effort, anxiety, confidence — these directly affect how much you can produce and sustain. A rider who believes they can hold threshold will hold it longer than a rider who’s already negotiating with themselves at the 10-minute mark. I’ve been there on both sides.
There’s a reason some of my best power outputs came in races and some of my worst came in training sessions I didn’t want to be at. The legs were the same. The head wasn’t. When you’re asking what cycling data am I missing, sometimes the honest answer is: your own psychology.
The power meter is the best tool we have. I love mine. But a number without its six invisible layers is just a number. Wind, terrain, fatigue, pacing, physiology, psychology — these are the things wrapping around every watt you produce. Start reading those layers alongside your data, and suddenly you stop being confused by your numbers. You start actually understanding your riding. That’s where the real improvement lives.